How to Integrate a Mobile App Analytics Tool
Published: June 6, 2022
10 min read


In this article, you'll learn:
1
📊 Mobile App Analytics Use Cases
2
📱 Main Mobile App Analytics Tools & Providers
3
🚴 Our Mobile Analytics Integration Expertise: Sportplus
4
📚 Firebase Analytics Implementation with Typescript
5
💡 Takeaways
Let’s imagine you’re the owner of an extremely popular app that attracts millions of users per day. Yet, there’s a slight problem: the users don’t seem to buy one particular product that you think should be getting more purchases. If you try to play detective and deduce what could be the reason, you’ll face a huge number of possible issues:
- The users see the bad rating of the product and then leave the screen.
- The users fail to check out the product, and the app crashes.
- The users on average don’t even get to the screen with the product.
- They spend a lot of time reading the description of the product but eventually decide they’re better off without it.
But how do you verify which of all these hypotheses is the real reason behind your problem?
App analytics is the thing that can give you an answer. Using the right tool you’ll be able to see how much time your users spend on the screen, and which buttons they press, thus helping you to understand their intentions better.
Strictly speaking, app analytics allows you to measure user interactions within your app while giving you general statistics without breaking the privacy of the users.
But the problem is that there are numerous mobile apps analytics providers out there, and each of them works best only in certain cases. How do you know which of them to choose?
In this article, we’re going to answer this question, giving an overview of some of the analytics use cases, its main providers, and a couple of our own case studies.
📊 Mobile App Analytics Use Cases
Before choosing an analytics provider, you first have to define the tasks you want to solve. This section will give an overview of the major analytics use cases and its related terminology.
- Tracking User Engagement
The main reason why you might want to implement analytics in your app is to track the engagement of your users. Engagement is a very broad term meaning the response of your users to your digital product. This includes:
- Installs of your app.
- Sessions when users open your app.
- Time they spend using it. This can also include the time users spend on specific screens in the app or on pages in websites.
- **Retention. **This is a measurement of how many users return to your app after the first open.
- Churn rate. This is a metric opposite to retention and shows how many users have abandoned the app. While this might not be a very useful metric in itself, it usually works well when comparing it with other data. For example, you might see a correlation that users who don’t buy a subscription (and so have limited functionality) tend to abandon the app.
- User events in the app. For example, you might want to track how many people press a specific button, or how many of them open a specific screen. This metric can be visualized as a heatmap, showing the places of most activity:


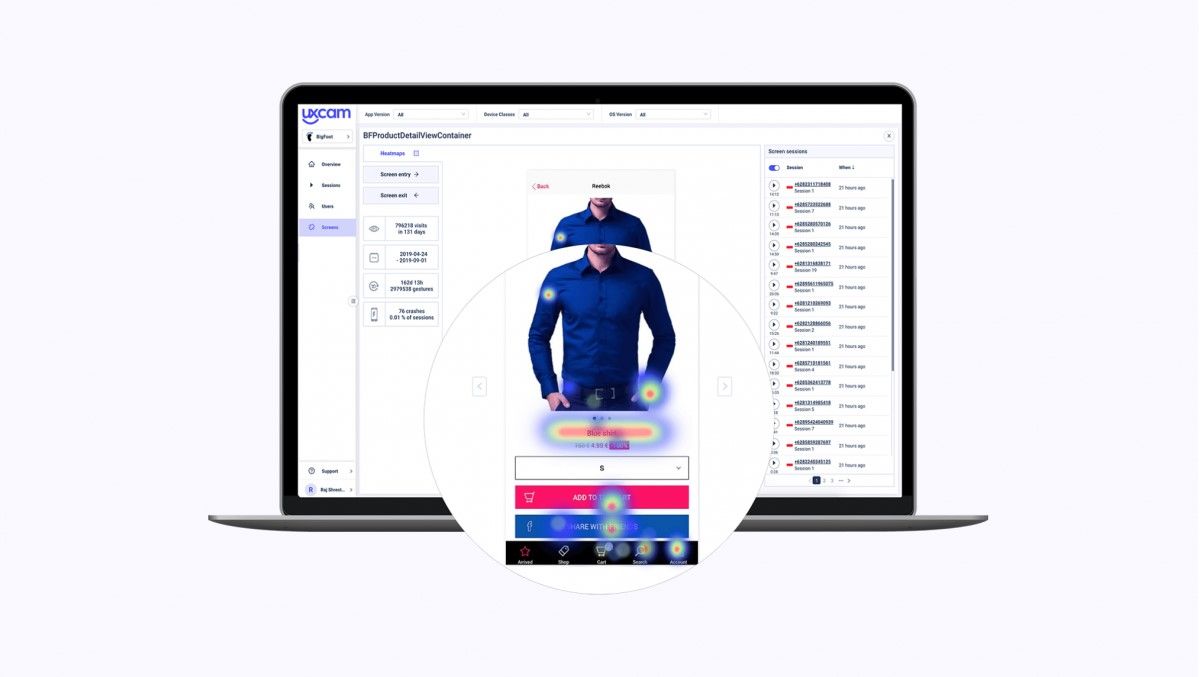
In this article, we’ll talk about various mobile app analytics tools and what app metrics you can track (image by UXCam)
- Crash Reporting & Error Logging
Ideally, as an app owner or developer, you want to have every bug or crash fixed, and that’s why you need to know about each time a user gets an error. Tracking this manually might be very time-consuming, and that’s where crash analytics tools come into play. They give you a better understanding of what kinds of bugs your users experience, all sorted by the app version and time so that you can prioritize which bugs to fix first.
Some tools, such as Firebase, can even send you a push notification in case there’s a rapid rise in the number of issues.


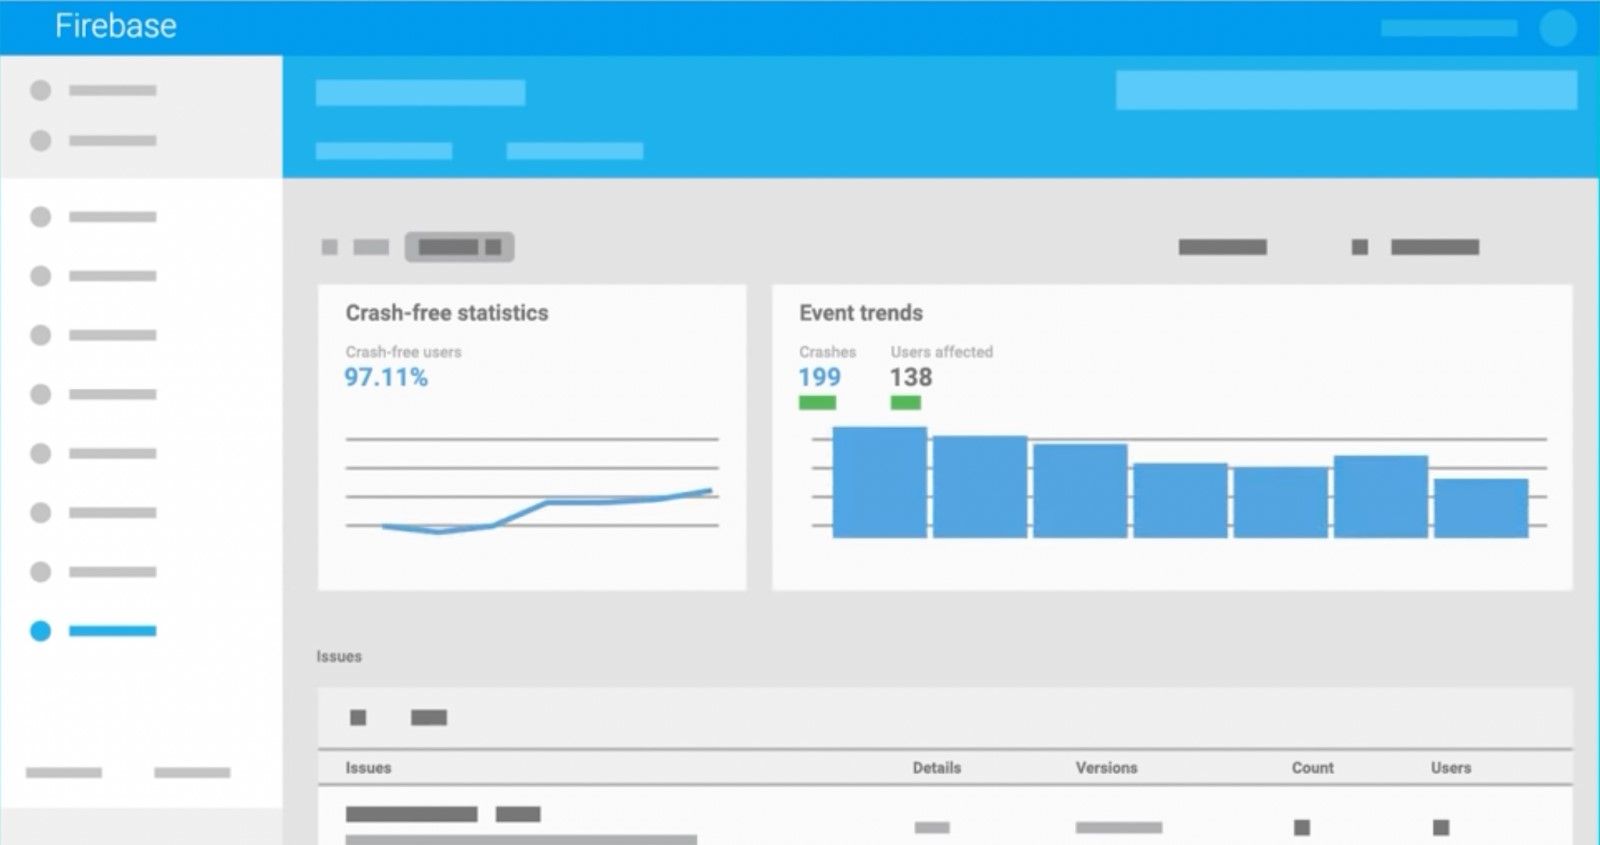
You can use mobile app analytics tool for crash reporting and logging errors so that app users don’t face them (image by Firebase Docs)
- Mobile Apps A/B Testing
Another interesting analytics use case is A/B Testing. Let’s imagine that your designers have created two versions of the same screen, but you’re really struggling to choose as they both look equally great.
In that case, you might want to choose the one that your users would like more. A/B testing tools manage to estimate that by dividing users into groups at random and showing one version of the screen to one group, and another version to the other. It then tracks any relevant statistics about the two screens and gives you an overview to help you make a better decision.
For example, below you can see how A/B testing works when deciding the color of a button and finally leads to a rise in sales.


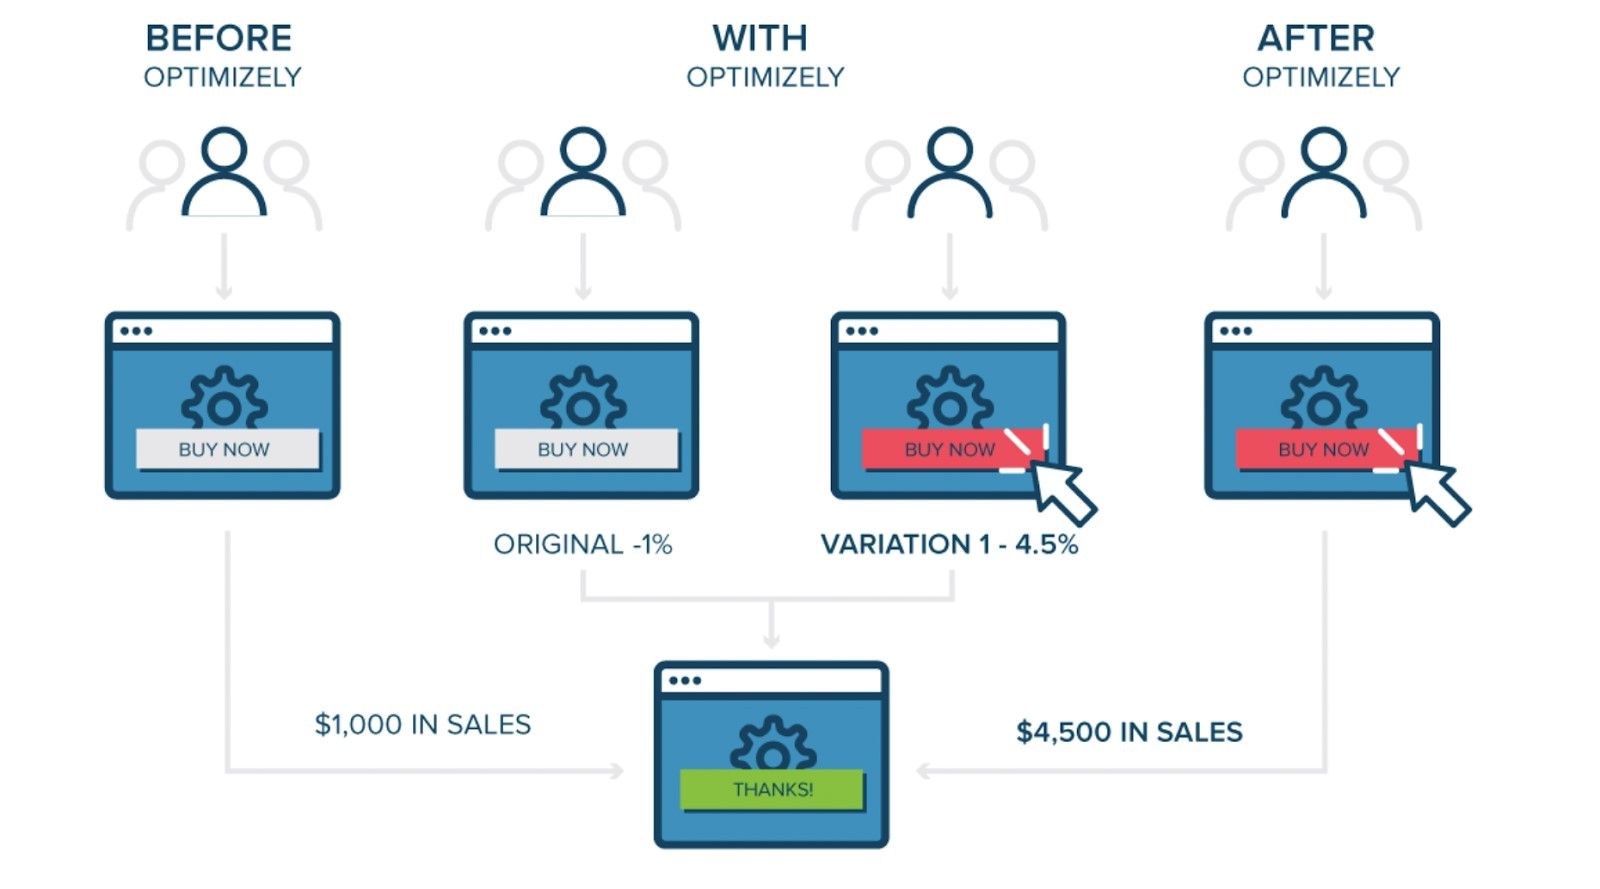
Mobile app analytics tools like Google Analytics can also help you with A/B testing implementation (image by Optimizely blog)
📱 Main Mobile App Analytics Tools & Providers
Another challenge you might get when implementing analytics in your app is choosing the provider itself. Different providers can vary a lot in terms of their visualization techniques, functionality, pricing, and platform support. This section will look at some of the most popular analytics providers and compare them.
Firebase
The most popular analytics tool is Firebase Analytics (a.k.a. Google Analytics). Some of its main features are:
- Event tracking. Here you can both define custom events (such as presses on a particular button), and get information about built-in events, such as app launches and user retention. The event tracking dashboard looks like this:


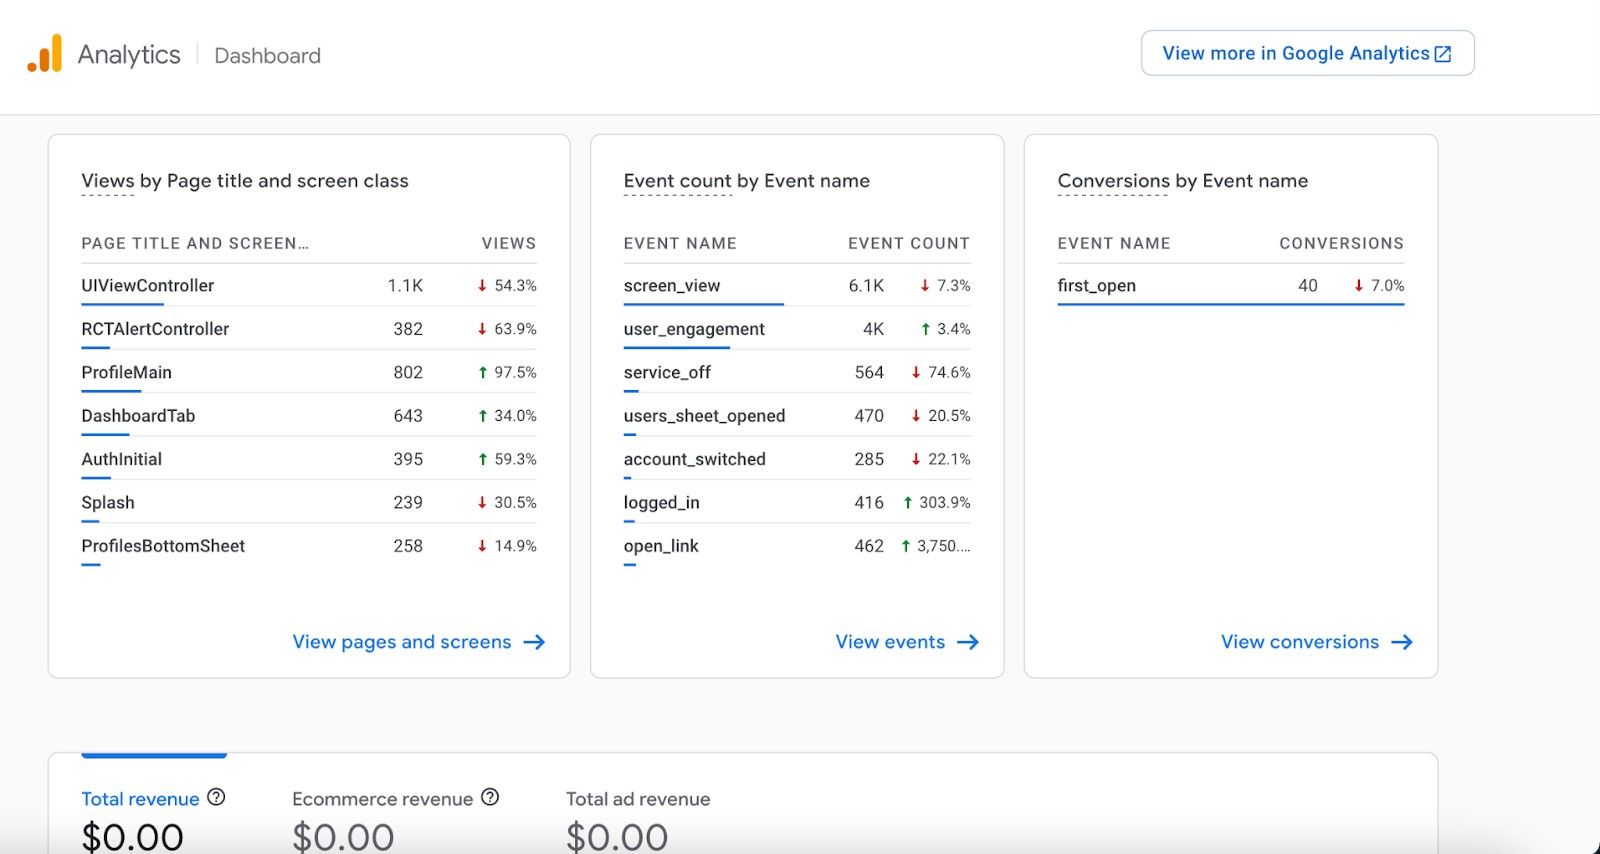
Mobile app analytics tools can help with track users behavior as part of marketing analytics (image by Firebase)
- Real-time overview. Firebase can also give you real-time data about how many users currently have the app opened, their geographical location, most used app version, etc. Here’s how it looks:


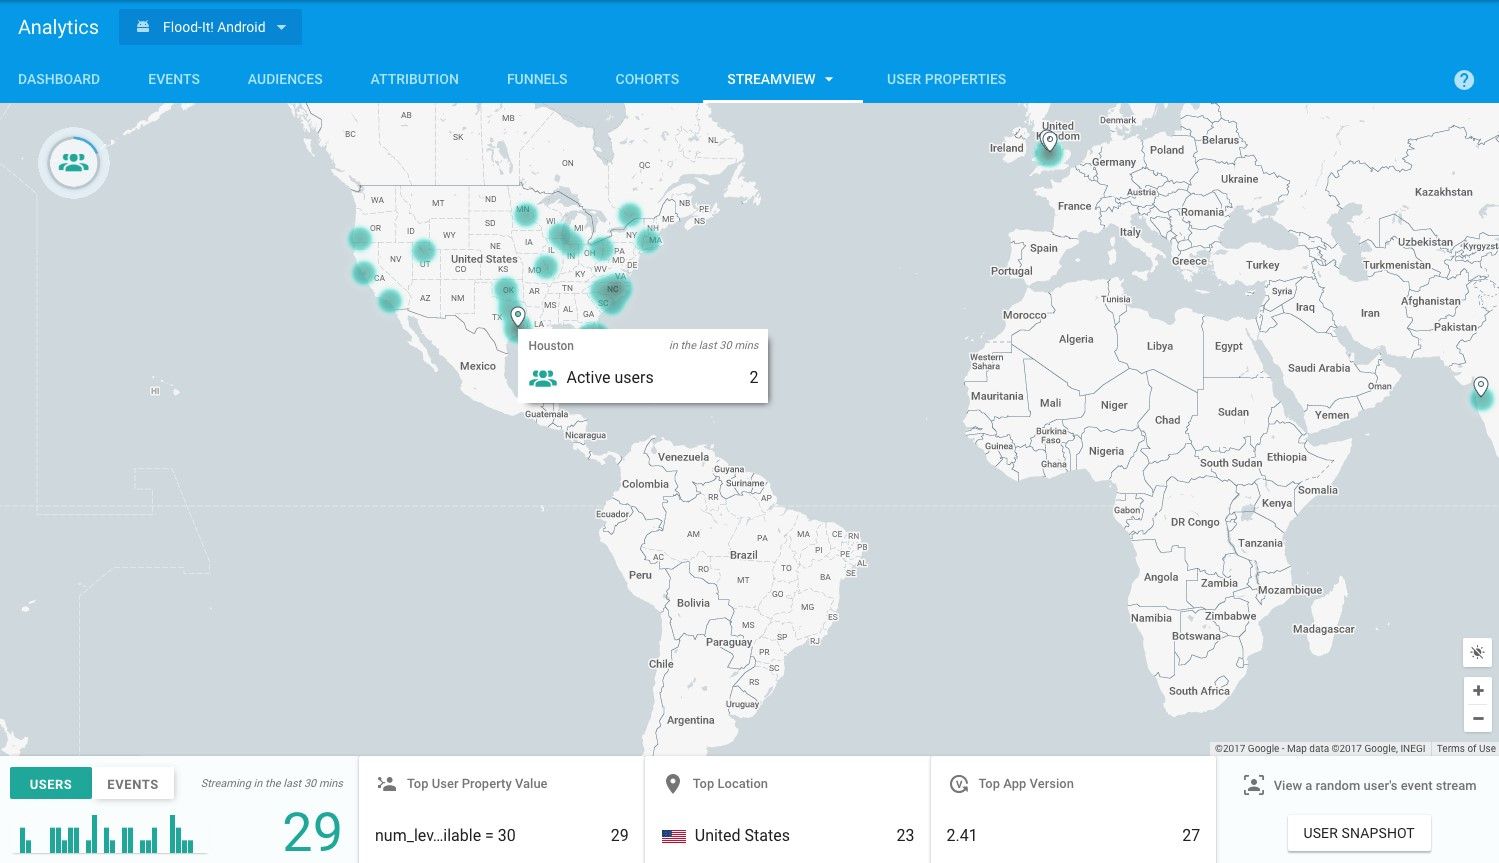
Mobile app analytics tools also have real-time analytics elements (image by Firebase Blog)
- Audiences. Firebase also allows you to split your users into audiences, and track each audience separately. This is useful when you care more about the experience of a specific group of users. For example, you might create an audience of people who have made a purchase.
- A/B testing. Firebase also allows you to set up A/B testing for your apps, which looks like this:


Mobile analytics allows splitting users into smaller groups during user sessions (image by Apphud Blog)
Pros:
- Has almost all the most important analytics features: crashlytics, event tracking, A/B testing, real-time data
- Works for both mobile apps and websites
- Has a great free plan
- Is part of the whole Firebase ecosystem, making it easier to integrate other Google’s services with analytics. For example, you can set up Firebase Cloud Messaging (push notifications) to send data to the analytics module, thus showing how many users open the notifications you send
Cons:
- For large apps, the pricing might get high, as Firebase has the “pay-as-you-go” model, meaning that the more user events your app sends, the more you’ll have to pay
- Lacks some visualization techniques, such as heatmaps.
Mixpanel
Another popular analytics tool is Mixpanel. The functionality here is more limited, but it still offers the most important features needed for analytics, such as tracking events, user engagement and retention.
One of its advantages over Firebase is that it allows you to compare different metrics better. For example, Firebase considers iOS and Android versions as different apps, making it harder to compare their performance, but Mixpanel allows you to put the data from the two platforms side-by-side. In the following screen we can see how the iOS version has a significant drop in conversions:


Mobile analytics tools help businesses with product analytics (image by Mixpanel site)
Pros:
- Has a nice free plan, and relatively cheap paid ones (starting at $25/month)
- Has powerful visualization options & data filters
- Has A/B testing
- Works with both mobile platforms & the web
Cons:
- Has a steep learning curve when it comes to setting up the events
- Lacks user acquisition analytics
UXCam
UXCam is another popular tool that is especially good at visualizing the data received from the apps. For example, it offers heatmap analytics that looks like this:


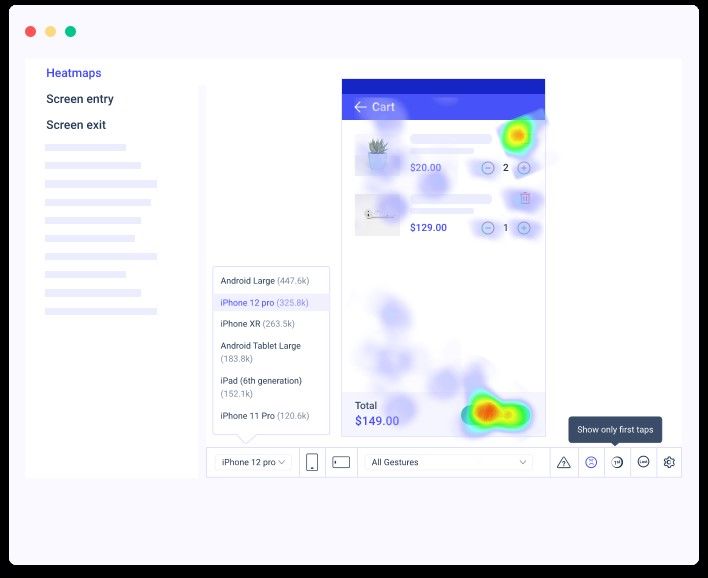
You can surely uninstall tracking tools from the devices and websites in case you don’t need them anymore (image by UXCam)
UXCam also does a great job at visualizing screen flows, i.e. typical journeys of users through the screens, along with the percentages of people that pass from one screen to another:

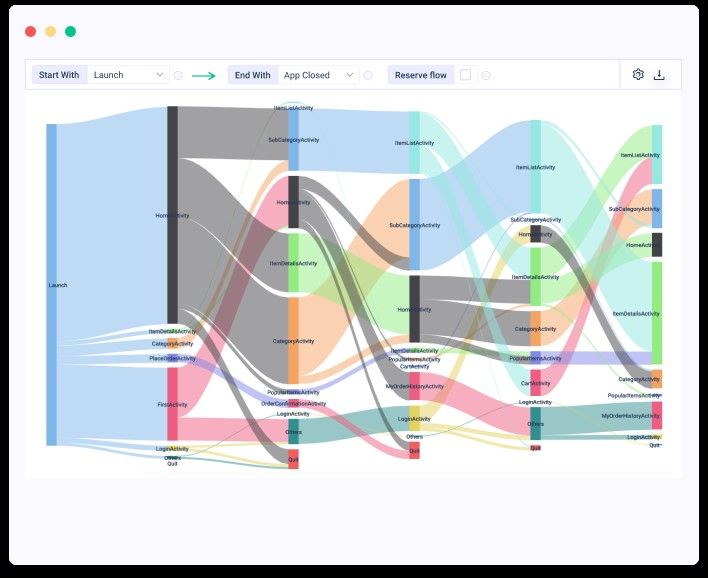
UXCam’s benefit is has great tools for visualizing your app analytics (image by https://uxcam.com/)
Pros:
- Event & conversion analytics
- Heatmaps
- Screen flow visualization
- Issue analytics
- GDPR-compliant
- Has integrations with Firebase, Amplitude, and Crashlytics
Cons:
- Only available for the mobile platforms
- The pricing isn’t transparent (you have to request it)
Amplitude
The last analytics tool we’ll cover in this article is Amplitude, which was called the #1 leader in product analytics by G2. Amplitude has most of the features you’ll ever need, coupled with great visualization of the data. For example, here’s a chart of user journeys:


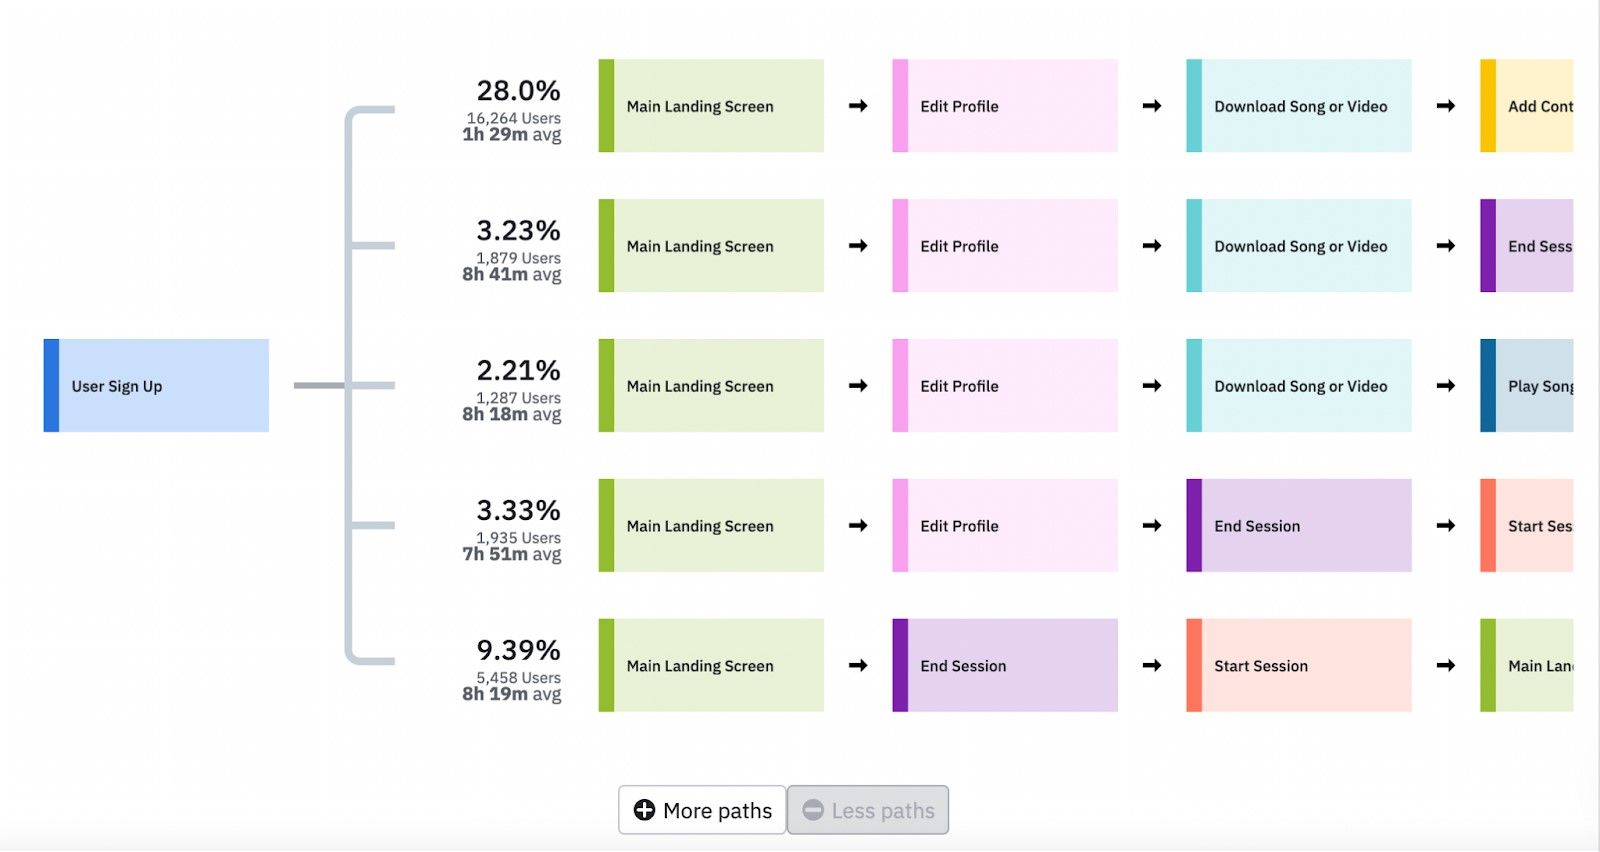
Almost any app analytics tool like Amplitude or Google Analytics provides users with great visualization features (image by Amplitude)
Pros:
- Supports most of the conventional metrics: engagement, conversions
- Custom events
- A/B tests
- Powerful visualization
Cons:
- Might be a bit harder to learn than other tools
- Has steep pricing (from $995/month, according to GetApp).
🚴 Our Mobile Analytics Integration Expertise: Sportplus
Sportplus, our recent mobile project, required a custom and complex analytics integration.
Sportplus is our Germany-based client, and a manufacturer of workout devices: cross trainers, treadmills, trampolines, etc. The problem was that there was practically no way to know the users without an app, as after selling the device all connection with the buyer was lost. Sportplus contacted our team to develop a tailor-made app that would connect to the devices, and gather analytics about users.
We needed the analytics in a couple of different places in the app:
- To log user events in the app, such as pressing specific buttons or going from one screen to another. For this we used Firebase Analytics, and its React Native SDK to integrate Firebase into the app.
- To integrate analytics with push notifications in order to know how many of them are opened. Since we used Firebase’s Cloud Messaging, we got an integration with Firebase Analytics out of the box, so to link the notification with an event all you have to do is to choose the event in the dropdown:


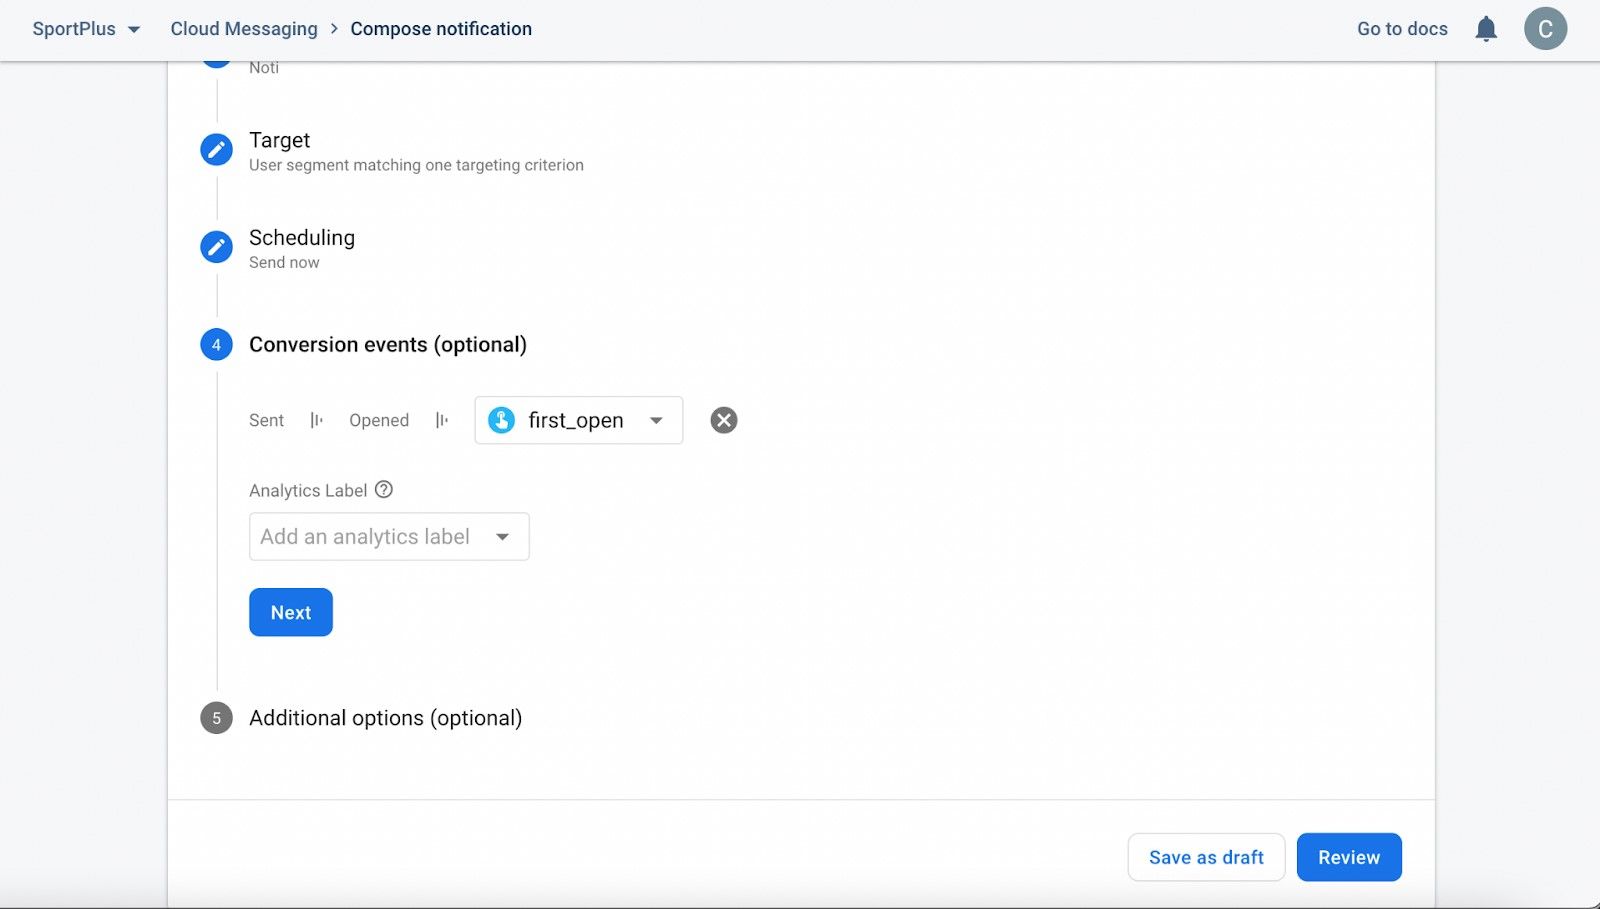
Integrating Google Analytics into mobile apps can be pretty highly beneficial with the right approach (image by Firebase Analytics)
To create Bluetooth logs. The app relies heavily on BLE connections, so we wanted to ensure that the developers see every possible error the users get. For this, Amplitude proved to be a good option, as it allows us to send error logs along with the events, and later see the logs in the dashboard.
📚 Firebase Analytics Implementation with Typescript
Note box: This section is going to deal with the technical implementation of analytics, so if you’re more interested in a general overview of analytics providers, feel free to skip this section.
Since the Sportplus App was built with React Native, we decided to go with react-native-firebase to connect to Google’s APIs. Yet, the problem was that this library doesn’t allow us to create nice TS typings, which means you’d basically have to log any types. To deal with this, we decided to create a custom system of typings that had the following form:
Code block (typescript):
Naturally, there were more types than this, but for the sake of simplicity, we’ll limit ourselves to this.
Then, we created a couple of helpers that wrap around rn-firebase’s functions and apply the types mentioned above. The most important helper is logEvent:
Now, all you have to do, is call this helper, and TS will automatically help you with the typings:
Finally, it’s a good thing also to set up logging all screen transitions, so that you can see which screens are visited most often. To do that with react-navigation, we can create a wrapper around NavigationContainer like this:
Then, all you have to do is to use the wrapper in your App.tsx.
Well done!
💡 Takeaways
Now, let’s make a quick recap by deciding which analytics tool to use in which case:
- If you want it to be cross-platform, including the Web, choose Firebase or Mixpanel.
- If you want strong integrations with a bigger development ecosystem, Firebase is a great option.
- If you require detailed and comprehensive visualizations of the data, with it being easy to understand, consider UX-Cam, Amplitude or Mixpanel.
- For small apps and projects without much funding, Firebase or Mixpanel sound like great options.
So, this is it! We hope you’ve liked the article, and in case you need any help with building analytics-integrated apps, feel free to reach out!
Our clients say

![Stormotion client Max Scheidlock, Product Manager from [object Object]](/static/33294af91c38256bcd5a780ddc41861a/1b3aa/max.webp)
They understand what it takes to be a great service provider, prioritizing our success over money. I think their approach to addressing ambiguity is their biggest strength. It definitely sets them apart from other remote developers.
Max Scheidlock, Product Manager
HUMANOO
Was it helpful?
Read also